Interactive telemetry graphs display real-time data for fastest qualifying laps across all F1 calendar rounds. Visualize vehicle speed, throttle position, RPMs, and gear selection as drivers navigate each corner and straight on the circuit.
Interactive Formula 1 Data Visualization Dashboard
Apex Graph is a comprehensive interactive dashboard designed for analyzing actual Formula 1 data. Built to provide deep insights into racing performance, it offers real-time telemetry visualization and historical data analysis for the entire F1 calendar. Whether you're a racing enthusiast, analyst, or team member, Apex Graph delivers the data you need in an intuitive and engaging format.
Experience the thrill of Formula 1 through data with our cutting-edge visualization platform. Track every detail of a racing lap, from speed variations to gear changes, all synchronized with an animated track map showing the vehicle's position in real-time. Apex Graph brings the numbers to life, making complex telemetry data accessible and actionable.
Dive deep into the fastest qualifying lap telemetry graphs for all rounds of the F1 calendar. Apex Graph provides comprehensive visualization of critical performance metrics including vehicle speed, throttle position, RPMs, and gear selection. These metrics are animated as the vehicle completes the lap, allowing you to see exactly how drivers navigate each corner and straight.
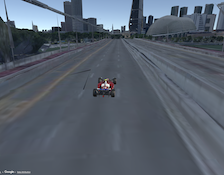
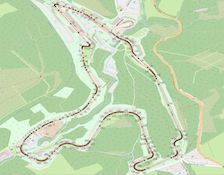
The track map feature displays an animated vehicle position synchronized with the telemetry data, providing spatial context to the performance numbers. Watch as the car progresses through the circuit while simultaneously monitoring how speed, throttle input, and gear selection change throughout the lap. This correlation between position and performance data reveals the intricate details of racing strategy and driving technique.
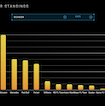
Beyond lap-by-lap analysis, Apex Graph includes comprehensive Constructor and Driver standings graphs showing data for all F1 seasons. Track championship battles as they unfold, analyze historical trends, and compare performance across different seasons. The standings visualization provides a clear picture of competitive dynamics throughout Formula 1 history.
Apex Graph is powered by Apex Server, ensuring reliable data delivery and real-time updates. Available for Windows, OSX, and other platforms, you can access the live web demo or download the application for offline use. Experience the power of data-driven Formula 1 analysis with Apex Graph.
Interactive telemetry graphs display real-time data for fastest qualifying laps across all F1 calendar rounds. Visualize vehicle speed, throttle position, RPMs, and gear selection as drivers navigate each corner and straight on the circuit.
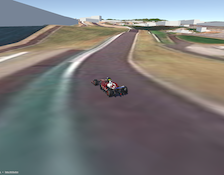
Animated track map synchronized with telemetry data provides spatial context to performance metrics. Watch the vehicle progress through the circuit while monitoring speed changes, throttle input, and gear selection in real-time.
Comprehensive Constructor and Driver championship standings graphs for all F1 seasons. Track championship battles, analyze historical trends, and compare performance across different years with detailed data visualization.
Experience Apex Graph directly in your browser with our interactive web demo.
Available for Windows, OSX, and other platforms for desktop use.
Reliable REST API backend delivering real-time F1 data via JSON.